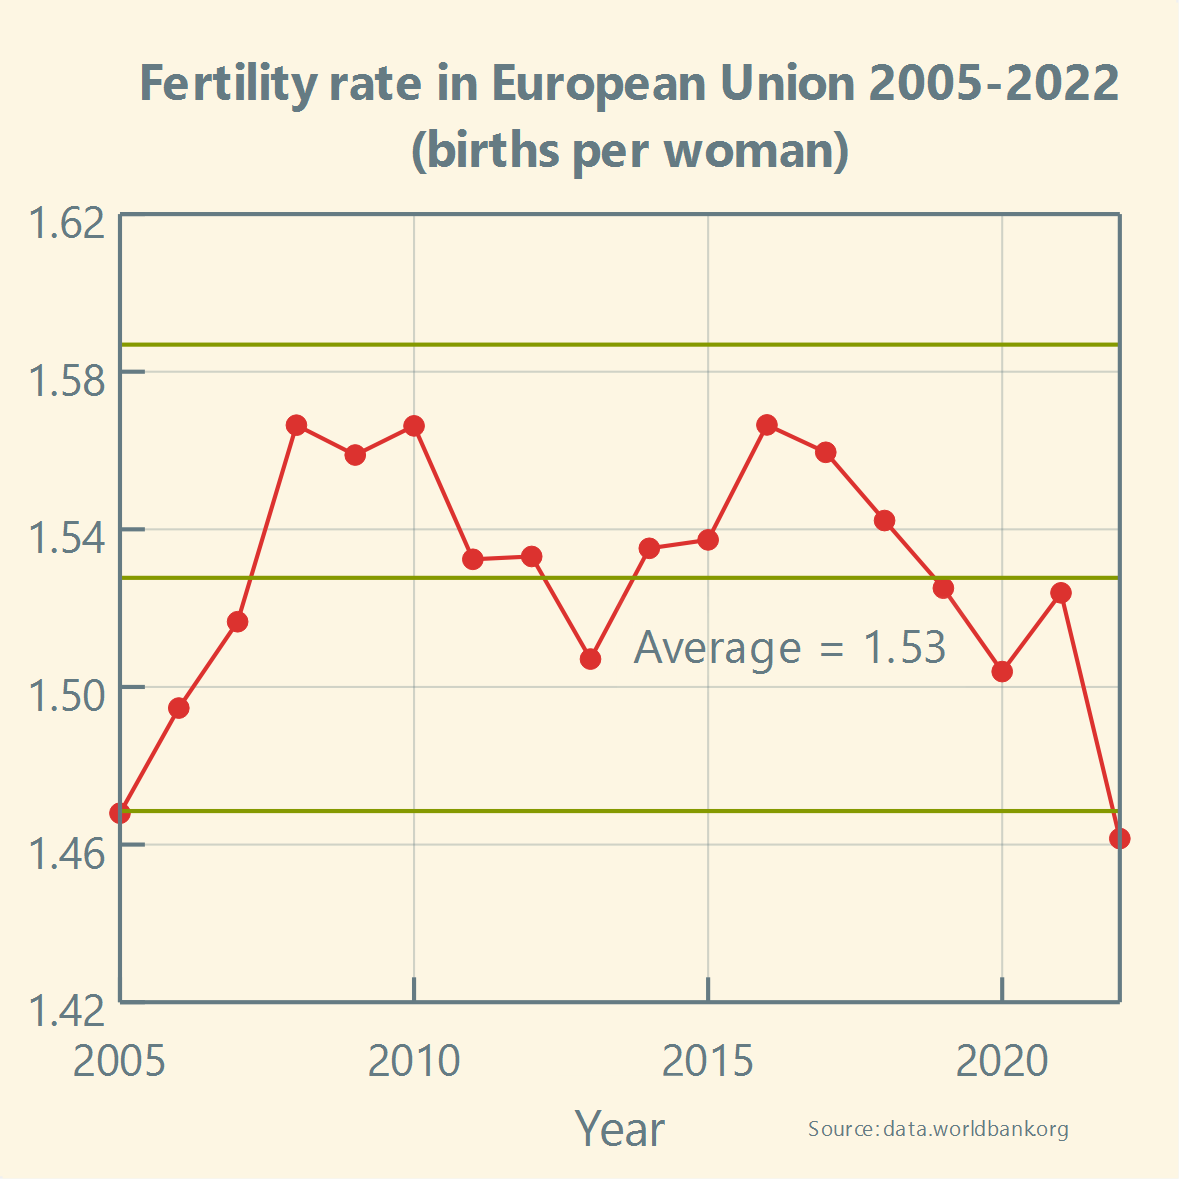
Has the #FertilityRate in the #EuropeanUnion been stable over the past two decades?
A simple #XmR chart available in @LabPlot [2.12dev] can be used to track the stability of any process.
Boosts appreciated! :boost_love:🚀
➡️ https://en.wikipedia.org/wiki/Shewhart/_individuals/_control/_chart
@europesays @dataisbeautiful @[email protected]
#Europe #Future #EU #Europa #Fertility #Politics #Healthcare #Health #BirthRate #Demography #Population #Biology #News #Community #Statistics #FreeSoftware #OpenSource #ControlChart #LabPlot #Data #dataViz
@coucouf @europesays @[email protected] @dataisbeautiful
Let us reply by quoting Howard Wainer. In his well-known paper “How to Display Data Badly” he wrote:
“A second way to hide the data is in the scale. This corresponds to blowing up the scale (i.e., looking at the data from far away) so that any variation in the data is obscured by the magnitude of the scale. One can justify this practice by appealing to “honesty requires that we start the scale at zero,” or other sorts of sophistry.”
@[email protected] @europesays @[email protected] @dataisbeautiful very nicely framed but unconvincing. I can reverse the argument and call it sophistry. Data visualisation inherently conveys a message and you can’t avoid having to choose what you want to say. Besides most data has a confidence level so at some point by blindly applying this “principle” you’re just showing noise.
@coucouf @europesays @[email protected] @dataisbeautiful
Thank you for your comment. For these types of charts describing variation in data, which also include upper and lower limits on the values that contain probable noise, not using 0 at the start on the y-axis makes sense, as it makes it easier to analyze this variation and detection of potential signals.
We believe that Howard Wainer certainly would not recommend blindly applying this principle to all cases.